pcray1231
Well-known member
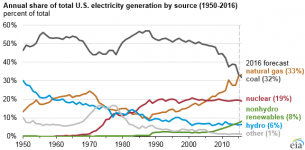
The gas boom has led to an energy boom, resulting in the balance of power generation shifting heavily towards natural gas over coal. This started way back in the 80's but has accelerated especially from 2008 and on. It has allowed the shutdown of older coal plants without inducing brownouts, both under natural economic forces as well as spurred by more stringent EPA regulations that were made possible by the existence of a viable alternative. The shutdowns to date have numbered approximately 50 plants in the Ohio Valley where most of our acid rain comes from, and were of the oldest and dirtiest, with only newer or upgraded plants with the latest scrubbing systems still operating.
I was interested in how this affects acid rain. The following are measurements on rainfall taken over time. Given is pH (higher is less acidic). You can also easily click on other contaminants, such as SO4 (most others, lower is better). These are the older sites, with data starting prior to 2005. There are a lot of PA testing sites that came online more recently, and are ok for comparison of rainfall in different areas, but have too little data over too short a time period to discern an actual trend. So I excluded those.
State College: http://nadp.sws.uiuc.edu/data/ntn/plots/ntntrends.html?siteID=PA15
Young Woman's Creek: http://nadp.sws.uiuc.edu/data/ntn/plots/ntntrends.html?siteID=PA18
Kane: http://nadp.sws.uiuc.edu/data/ntn/plots/ntntrends.html?siteID=PA29
Huntingdon: http://nadp.sws.uiuc.edu/data/ntn/plots/ntntrends.html?siteID=PA42
Milford: http://nadp.sws.uiuc.edu/data/ntn/plots/ntntrends.html?siteID=PA72
Millersville: http://nadp.sws.uiuc.edu/data/ntn/plots/ntntrends.html?siteID=PA47
This is the good side (environmentally speaking) of natural gas.