wildtrout2
Well-known member
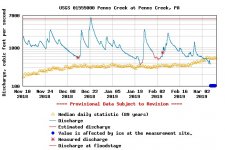
It's hard to believe that almost a quarter of the state is showing orange and red dots already, especially after all of the rain we've gotten since last summer. I hope this doesn't become a trend.
acristickid wrote:
I know in the western PA it’s still all frozen. There is close to a foot of snow in the ridges of the Laurel Highlands. Need a big warm up and maybe a warm rain , blowout then we can warm this water up.
wildtrout2 wrote:
It's hard to believe that almost a quarter of the state is showing orange and red dots already, especially after all of the rain we've gotten since last summer. I hope this doesn't become a trend.

troutbert wrote:
There is very little relationship between rain last summer and stream flow now, 7 months later.
I mentioned the rain we've gotten SINCE last summer.troutbert wrote:
There is very little relationship between rain last summer and stream flow now, 7 months later.
")
poopdeck wrote:
I check the river gauges everyday even when I'm not fishing. It's just become a habit. Seems to me that last years weather pattern has been continuing this year with rain every 3 or 4 days all winter.
wildtrout2 wrote:
It's hard to believe that almost a quarter of the state is showing orange and red dots already, especially after all of the rain we've gotten since last summer. I hope this doesn't become a trend.