Freestone Stream Flows

Swattie87

Swattie87

Well-known member
Joined
May 3, 2011
Messages
5,830
Amazing how much they are tied to recent precipitation...As in the last several days to a week or two tops. Makes it tough to plan bigger fishing trips in advance as the flows can change so much in just a matter of days.

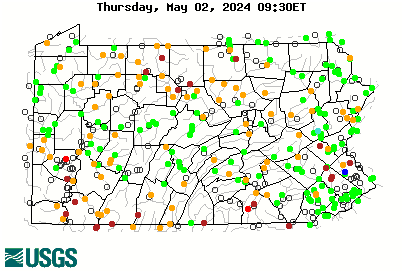
Take a look at the USGS map for PA...SW corner of the state now largely orange and red. Nothing to be concerned about clearly, and it's relative to this time of year, but still...Two weeks ago that area was at its banks or in many spots, streams were out of their banks. This February was one of the wettest on record for SWPA. I fished a small Bedford County headwater stream on 2/24 that was almost too high to fish! Now it's probably what I'd call "low." It's really a "what have you done for me lately" game with freestoners and precip...Even in the late Winter/early Spring when groundwater flows are strongest.

 
A lot of the relationship is hand to mouth, sure.

I think though that this year, and particularly over the past week or two, freestone stream levels are being skewed somewhat by the partial re-freeze we've had lately with below normal temps. Until it warms up again, at least some of the water that would normally be in the streams is out of circulation because it is in a solid state.
 
Yes, no question.

Raging for what seemed like weeks just a week or two ago.

Have fished several tiny stream lately because most waters were too high. Now with in a weeks time they appear low.

I wonder if S87 fished the same stream as I did yesterday. Water was nice and low and very clear.
 
Swattie, you were reading my mind this morning. I was looking at that map and thinking the same exact thing. It is amazing how quickly stream conditions change, even with the precip. I'm no hydrologist, but my observations over a good many years show me that many streams simply do not have the flows they once had. I'm convinced that our water tables here in Pa, generally speaking, aren't what they were.
 
We had a lot of rain and rapid snow melt in a short period and neither since then. Stream levels seem pretty typical. In fact, they're probably what most fisherman would consider ideal over much of the state.

I think the ability to check conditions in real time and at a moments notice really messes with our minds sometimes...

Also, we are in a period of the year when the mean and median stream flow numbers are skewed by heavy snow melt and rain. And that in turn, causes us to see scary red and orange dots on the USGS map when neither of those things is occurring.
 
I was out and about in the Laurel Highlands yesterday. I would say they’re about ideal right now. Now if it would just get above freezing for more than a few hours at a time to get some bugs and fish moving, we’d be in good shape!
 
Should've probably explained my OP a little better. The dots and percentiles are based off how the stream flow on a given date correlates to the historical flow on that same date. Meaning today, March 16th, is compared against March 16th historically at the gauge site.

Practical application as it pertains to this thread...Red or orange dots now during the late Winter/early Spring still likely correspond to higher flow rates than green or blue dots say in August or September, a time of year with generally much lower average flows.

Red/orange at this time of year is probably ideal for fishing as 724 pointed out. Blue is probably ideal in August or September. It's all relative to the time of year.

I wasn't trying to imply flows were dangerously low, or unfishable or anything. Just that flows on freestoners can change drastically over a two week period. These same red/orange dots were all blue, and many black (highest recorded for that given date), just a few weeks ago. They react quickly to rain, or the absence of rain.

I don't like em' chocolate milk or blown out, but as mainly a small stream guy, I generally prefer more water to less in most situations.
 
You can't determine good fishing levels by the dot color for the reasons already explained.

After you've fished a stream several times and checked the flows on the USGS website for the time you fished, you can get it kind of "calibrated" what is low, high and just right.

But it's very hard to "figure" what levels are good, low, high for a stream you're unfamiliar with just by looking at the USGS website. If anyone has figured out a way to do that, please let us know.


The dot color just paints a relative picture, based on that certain date historically. It's important to know that a given color in March doesn't correspond to the same flow at that same dot color in September. That's the big point. That being said, you can still make some general estimations that can help you based on dot color alone. I've made stream decisions in unfamiliar areas based on my understanding of the dot colors, and what they represent generally speaking for a given time of year and the size of the stream I will be fishing.

Still, first hand knowledge of a certain stream at a certain specific flow rate is clearly ideal. I have a network of gauges across the state I've become calibrated with from fishing those streams, or fishing a nearby stream when the gauged stream is at a certain flow. (Clearly not every stream has a gauge on it.) It's still not foolproof and you'll swing and miss once in a while, but it's better than a blind guess, and more often than not, the destination stream is in the condition I expect to find it.

^Generally this approach works better in the Fall/Winter/Spring than it does in the Summer. Outside of Summer in PA, most rain events are associated with larger scale low pressure systems and their corresponding cold/warm fronts. Meaning if a stream 10 or 20 miles away from the one I'm fishing has a gauge on it, most of the time you can reasonably conclude that nearby streams will be in similar shape, relative to their size of course. Clearly there are exceptions to this, as in the case of a sharp precip cutoff in a nor'easter, but generally speaking it works pretty good.

In Summer, where most rain comes from T-Storms, it can be much more locally hit and miss. One watershed can get 2 inches of rain. 10 or 20 miles away may have gotten nothing.

Edit: One more point. With an unfamiliar gauge you can also draw comparisons against known flows at a familiar gauge of a certain watershed size. The USGS site will list the watershed size at a given gauge point. Again, this is a general application, and not foolproof, but generally speaking watersheds of similar size, produce streams of similar size.

For instance: I know from firsthand experience that Kettle Creek at Cross Fork’s upper limit for safe fishing is approximately 400 - 500 cfs. Dialed in is roughly 250. Kettle’s watershed at this site is 136 square miles. You can then generally extrapolate that an unfamiliar watershed of similar size, should produce similar conditions at similar flows. Topography, geology, watertables, etc can all affect this and it’s not an exact science. But again, better than a blind guess.


Back
Top